Tracking market activity with InfluxDB
I really enjoy trading as my primary activity in the online game Eve Online - it’s fun seeing your wallet grow. People call it “spreadsheet simulator in space” for a reason, it’s especially relevant if you’re into trading or industry - you have to calculate your profits!
It can be quite difficult to gauge profitability of a particular trade - you have to consider the margin, market movement and competition. With thousands of tradable items and thousands of markets - it can be challenging to find profitable items, which is why people build various tools to do that automatically. Estimating competition can be difficult. Unless you’re actively trading in an item - you often don’t know if someone will actively outbid you every minute, or if your order will stay at the top for days.
And this is what this mini project is about. I’ll focus more on technical details, since this is not a gaming blog and the game is just an outlet for the project.
What is trading and how it works, problem area
If you’re familiar with real life stock trading, this will probably sound familiar. But if you’re not, here’s how trading works in a nutshell.
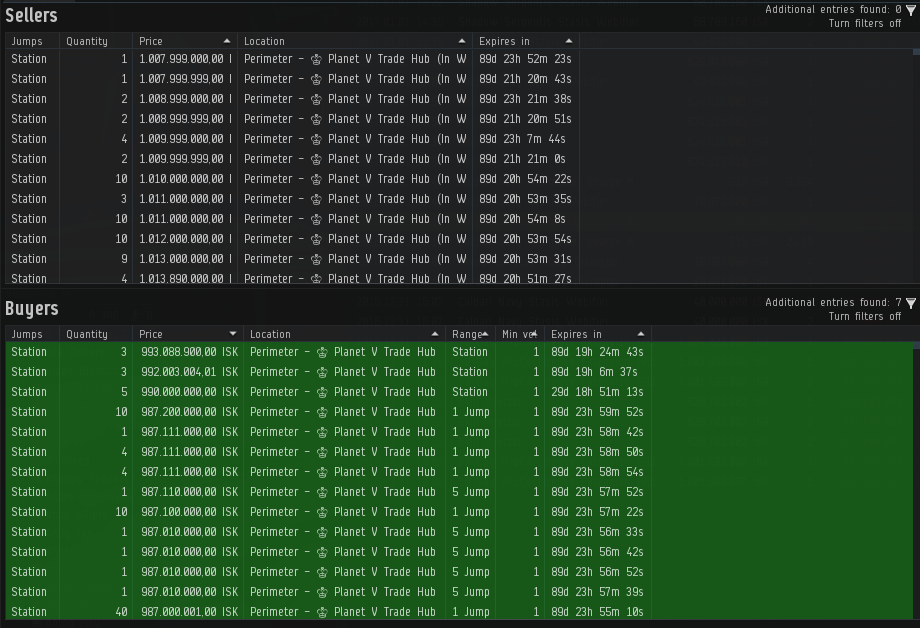
There are buy and sell orders. If you want to sell something, you can create a sell order for that item by specifying a price, and it will be created on the market. If someone wants to buy the item from you, they will have to pay your quoted price in exchange for the item. Sell orders are always fulfilled from the lowest price to the highest price, meaning that if there are two orders for 1$ and 2$ and someone wants to buy an item, the 1$ order will always be fulfilled first regardless of whether the buyer is willing to pay 2$ for it. Respectively, if you want to buy something, you can put up a buy order for a specific price and number of items (e.g. “I am willing to pay X$ each for 20 items”). If someone chooses to sell you an item, an exchange will be made, the seller will get your money, and you will get the item. Buy orders are fulfilled from the highest price to the lowest price. So higher-priced orders will be fulfilled first, hence the goal of keeping your orders on top.
You want to keep your orders on top to sell (or buy) your items fastest. However, if there are 10 other people trying to do the same thing at the same time - clearly that will be difficult. And in fierce markets your orders can be outbid in under 10 seconds!
Also, it’s worth mentioning that in Eve Online you cannot further update an order for 5 minutes after an order is created or last updated
So, knowing the times when your competition is active can be very helpful. Then you can come in just after they’re gone and get back to the top order for much longer, or spend less effort doing that.
Concept and technical setup
Going into this mini project, there is one main question I want an answer to: at what time(s) of day traders tend to update their orders. Optionally, it would be good to know how often they update their orders, or many items are sold at specific times of day.
The idea is to passively watch the market by taking snapshots of active orders, noting their IDs, prices and timestamps of latest update. Since orders can be updated only after 5 minutes, and the endpoint is cached for 5 minutes, it likely is a good enough approximation to take snapshots every 5 minutes. Once we have that information, we can use the database to group order updates into intervals and simply count the number of rows in each interval to get the number of updated orders.
I’ve learned about InfluxDB (a time series database) at work, and since then I’ve been meaning to find a personal project to use it on. Their Why time series data? page suggests several different use cases, such as tracking financial markets, sensor data or infrastructure data, which seems like a good fit for my problem.
I set up InfluxDB using the Getting Started guide, and used influxdb-python package for interacting with the DB.
Eve Online is special here, because they very actively expose game data via public APIs for 3rd party developers. So we can use their helpfully provided new ESI JSON API to query market data.
Implementation
We can fetch the market data from the JSON endpoint by making an HTTP request (Market > Orders endpoint docs). This can be done with requests library:
import requests

def get_item_orders(item_id, region_id, page=1, order_type='all'):
    esi_root = 'https://esi.tech.ccp.is/latest'
    url = '%s/markets/%d/orders/?type_id=%d&order_type=%s&page=%d&datasource=tranquility' % (
        esi_root,
        region_id,
        item_id,
        order_type,
        page
    )
    r = requests.get(url)
    response = r.json()
    if 'error' in response:
        raise Exception('Failed to get item orders', item_id, region_id, response)
    else:
        return response
Which returns a response in this format:
[{
  u'volume_remain': 4,
  u'type_id': 40520,
  u'order_id': 4696910017,
  u'issued': u'2016-12-01T10:20:35Z',
  u'price': 787000000.0,
  u'min_volume': 1,
  u'is_buy_order': False,
  u'range': u'region',
  u'duration': 90,
  u'volume_total': 4,
  u'location_id': 61000990
}, ...]
Here we mostly care about issued, type_id, location, order_id, is_buy_order, price and volume_remain.
issued denotes when the order was created or last updated, type_id denotes which item is being sold/bought.
Storing data in InfluxDB was straightforward with influxdb-python library:
from influxdb import InfluxDBClient

db = InfluxDBClient('localhost', 8086, 'root', 'root', 'market')

def fetch_orders():
    item_type_id = 40520
    region_id = 10000046

    try:
        orders = get_item_orders(item_type_id, region_id)
    except Exception as ex:
        print 'Failed to fetch orders'
        print ex
        return

    measurements = []
    for order in orders:
        measurements.append({
            'measurement': 'trade_history',
            'tags': {
                'region_id': region_id,
                'location_id': order['location_id'],
                'type_id': order['type_id'],
                'order_id': order['order_id'],
                'order_type': 'buy' if order['is_buy_order'] else 'sell'
            },
            'time': order['issued'],
            'fields': {
                'price': order['price'],
                'volume_remain': order['volume_remain'],
            }
        })

    db.write_points(measurements)
    print '[%s] %d orders fetched' % (datetime.datetime.now(), len(orders))
Here we simply iterate over a list of order objects, and out of them construct a list of measurement points.
region_id, location_id, type_id, order_id and order_type don’t change even when an order is updated.
Here an important point is to use the issued timestamp for the measurement time. That way we can accurately track when an order has been updated, and successive data fetches won’t duplicate the data.
If we run the code and check results in InfluxDB, we can see what we have:
> SELECT * FROM "trade_history" LIMIT 10;
name: trade_history
-------------------
time                    location_id     order_id        order_type      price                   region_id       type_id volume_remain
2016-10-30T20:37:10Z    61000647        4597357707      buy             5.6300000052e+08        10000046        40520   4
2016-11-21T07:07:57Z    61000990        4633264567      sell            7.8800000001e+08        10000046        40520   8
2016-12-01T10:20:35Z    61000990        4696910017      sell            7.87e+08                10000046        40520   4
2016-12-03T10:14:26Z    61000647        4699246159      sell            7.8300000052e+08        10000046        40520   2
2016-12-19T23:59:49Z    61000896        4657031429      buy             881                     10000046        40520   10
2016-12-28T19:58:22Z    61000647        4697110149      buy             4.13e+08                10000046        40520   1
2016-12-28T22:55:09Z    61000990        4667323418      buy             4.130000001e+08         10000046        40520   2
2016-12-31T08:13:49Z    61000990        4733297519      sell            7.19999998e+08          10000046        40520   5
2016-12-31T08:30:24Z    61000990        4733307476      sell            7.19999997e+08          10000046        40520   5
2016-12-31T08:39:25Z    61000990        4729427547      sell            7.1999999699e+08        10000046        40520   4
And lastly, to run this function every 5 minutes, schedule library comes in quite handy:
import schedule

schedule.every(5).minutes.do(fetch_orders)
while True:
  schedule.run_pending()
  time.sleep(1)
And now we have a Python script which will fetch outstanding market orders every 5 minutes and will log data to InfluxDB. At this point I left it running for several hours to gather some more data.
The last step is to query the data from InfluxDB.
It was very important to use issued order value as the timestamp for storing data in InfluxDB, because it changes each time an order is updated.
When an order is updated, it retains most of its data unchanged, however the issued and price fields will change.
Hence, if an order was not updated at the time of checking, it will not be included in the data groups of that particular time chunk.
That allows us to write this query:
SELECT COUNT("volume_remain") FROM "trade_history" WHERE "order_type"='sell' AND type_id='40520' AND time > now() - 7h GROUP BY time(30m)
Which yields this result:
> SELECT COUNT("volume_remain") FROM "trade_history" WHERE "order_type"='sell' AND type_id='40520' AND time > now() - 7h GROUP BY time(30m)
name: trade_history
-------------------
time                    count
2016-12-31T12:00:00Z    4
2016-12-31T12:30:00Z    0
2016-12-31T13:00:00Z    3
2016-12-31T13:30:00Z    0
2016-12-31T14:00:00Z    5
2016-12-31T14:30:00Z    7
2016-12-31T15:00:00Z    6
2016-12-31T15:30:00Z    11
2016-12-31T16:00:00Z    8
2016-12-31T16:30:00Z    9
2016-12-31T17:00:00Z    0
2016-12-31T17:30:00Z    6
2016-12-31T18:00:00Z    6
2016-12-31T18:30:00Z    2
2016-12-31T19:00:00Z    0
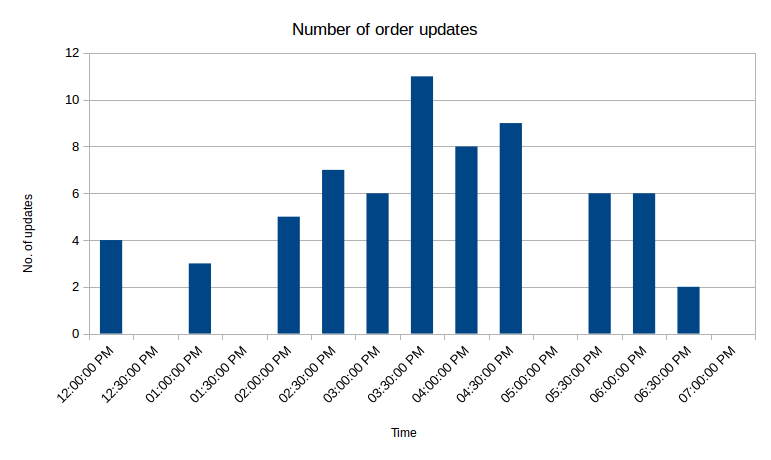
It’s not very important for this excercise, but we can take one more step and graph the results:
Graphing the price was not nearly as interesting, as compared to the price, differences are at most of several thousand ISK, which doesn’t show up well on the graph.
Gotchas
At first I was struggling to get a WHERE clause to work when writing InfluxDB queries: whenever I used WHERE - my queries returned no results. It turns out that InfluxQL requires using single quotes for denoting values, so this query will work:
SELECT * FROM trade_history WHERE "order_type"='sell'
While this will not:
SELECT * FROM trade_history WHERE "order_type"="sell"
Final thoughts
So in the 7 hours the script was running, there were over 50 order updates, and there were up to 11 updates in 30 minutes, which is very competetive. If you wanted your orders to stay on top, you’d have to trade quite actively in this particular location. But this is a great result. Just by glancing at outstanding orders it can be easy to be mistaken at how competetive competitors will be, but seeing longer term data paints a different picture. It would be useful to collect several days worth of data for several different items to evaluate the situation better, but this is already a good starting point.
It would be quite interesting to get access to raw data of actual real life stock exchanges and run the same script on the data. Some Bitcoin exchanges actually publicly display these orders as well, e.g. Real Time Bitcoin Ticker can be interesting to watch.
Subscribe via RSS