Sending Arduino sensor data via Bluetooth to a Python app
I wanted to build a solution to allow dropping off multiple battery-powered sensors (e.g. temperature, humidity, accelerometer) spread out over an area, collecting and processing their data in near real-time. One approach would be to use networking over WiFi, but it is not always available. A while back I wrote about using JY-MCU Bluetooth module to communicate with purpose-built Bluetooth utilities. Now I want to take a step further and set up Bluetooth communication with my own Python app.
The project will look as follows:
- Arduino will collect sensor data, in this case - temperature and humidity data, but it could easily be data from other sensors;
- Arduino will send the sensor data over the JY-MCU Bluetooth module to a Python application we’ll build;
- The Python listener will listen for sensor data and add them to InfluxDB timeseries database;
- Grafana will be used to graph the sensor data from InfluxDB.
1. Arduino setup
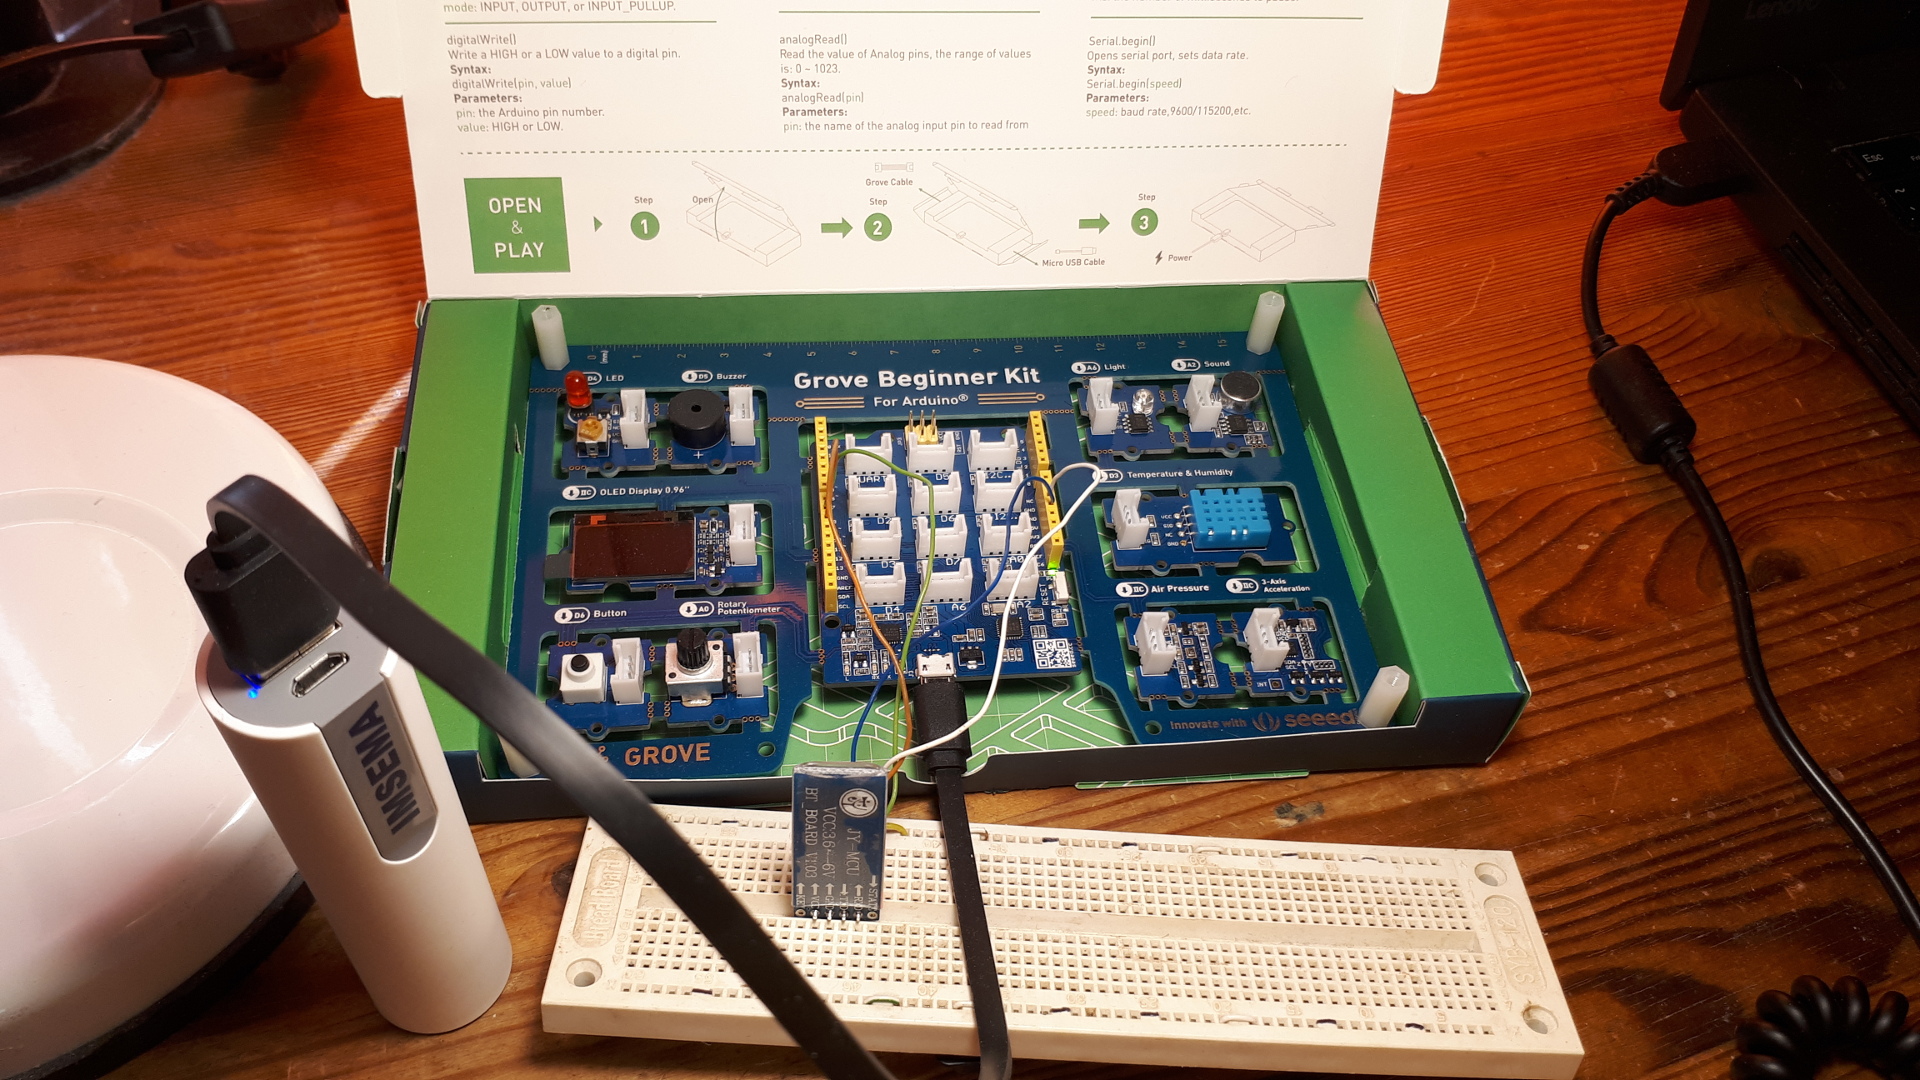
For this proof-of-concept I’ll use the Grove Beginner Kit from Seeed that they graciously sent over. While the kit is intended for beginners and education, it’s also convenient for small scale prototyping, as the kit comes with multiple pre-wired sensors (including the temperature and humidity sensor used here) and uses the modular Grove connector system.
For the bluetooth module, I’ll use the JY-MCU Bluetooth module from DealExtreme, however, DX no longer sell it. I have found a nearly identical version of it as HC-06 on TaydaElectronics: looks like the chips and the model are the same, just screenprinted markings are slightly different.
The temperature/humidity sensor is already connected to Arduino on my kit, unless you break out the sensors out of the PCB. Unfortunately my Bluetooth sensor is not Grove compatible, although with a soldering iron it would be fairly easy to make your own Grove-compatible connector, so I’ll make connections with 4 jumper wires on a breadboard as follows:
- JY-MCU RXD <-> Arduino Pin 9 (MUST SUPPORT PULSE-WIDTH MODULATION)
- JY-MCU TXD <-> Arduino Pin 10 (MUST SUPPORT PULSE-WIDTH MODULATION)
- JY-MCU GND <-> Arduino GND
- JY-MCU VCC <-> Arduino 5V
In the picture above the board is powered by a USB powerbank over a Micro USB connection.
Seeedstudio provide setup instructions and the sample code on how to use the sensor: wiki.
If you’re curious, the library code can be found here: Github. Sensor reads are fairly slow, having to wait for 250ms+, but for this use case it’s good enough.
For the Bluetooth part I’ve used the Arduino IDE built-in SoftwareSerial library.
Third, just for convenience sake, I used ArduinoJson library to send measurements as JSON over bluetooth. While using JSON will waste too much bandwidth on verbose data structures, it will help keep the data processing straightforward, as we’ll need to deal with partial data chunks later on, which would look as follows:
Received chunk b'{'
Received chunk b'"temperat'
Received chunk b'ure":22,"'
Received chunk b'humidity":'
Received chunk b'34}'
Even when trying to read 1kB at a time we get data in chunks. So to get the full record in this case it took 4 reads.
The final code looks as follows:
#include <ArduinoJson.h>
#include <SoftwareSerial.h>
#include "DHT.h"

#define DHTPIN 3 // Temperature/Humidity sensor pin
#define DHTTYPE DHT11 // DHT 11
DHT dht(DHTPIN, DHTTYPE);

const int RX_PIN = 10; // Bluetooth RX digital PWM-supporting pin
const int TX_PIN = 9; // Bluetooth TX digital PWM-supporting pin
const int BLUETOOTH_BAUD_RATE = 9600;

SoftwareSerial bluetooth(RX_PIN, TX_PIN);

void setup() {
   dht.begin();
   Serial.begin(9600);
   bluetooth.begin(BLUETOOTH_BAUD_RATE);
}

void loop() {
  StaticJsonDocument<100> doc;

  float measurements[2];
  dht.readTempAndHumidity(measurements);

  doc["humidity"] = measurements[0];
  doc["temperature"] = measurements[1];

  serializeJson(doc, bluetooth);
  serializeJson(doc, Serial);
  Serial.println();
}
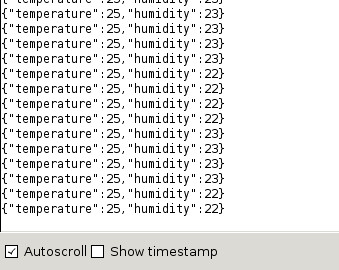
No surprises. DHT, SoftwareSerial and ArduinoJson all provide straightforward interfaces to use. This code will read the temperature and humidity sensor data and will write the resulting JSON to Bluetooth and Serial connections.
Serial output looks like this:
2. Python setup
For Bluetooth communication I used Pybluez.
Pybluez can scan for available Bluetooth clients, connect to and communicate with them. However, Pybluez does not provide any utilities to pair with the client, which a StackOverflow comment explains:
PyBluez does not support cross-platform pairing management. This is because some operating systems, like Windows, require super-user level permissions to programatically pair devices. On most operating systems, when PyBluez attempts to connect to the socket using the connect method, the operating system will try to pair (often asking the user for permission).
Inconvenient, so in the end I hardcoded the target address and having to pair the PC with the sensor manually, by using bluetoothctl command from bluez package. Not usable for production, but good enough for a prototype.
Secondly, you see that after receiving every chunk of data we’re trying to parse what we’ve received so far as JSON. This is because data arrives in chunks, and it may take several chunks to receive a valid JSON payload:
Received chunk b'{'
Received chunk b'"temperat'
Received chunk b'ure":22,"'
Received chunk b'humidity":'
Received chunk b'34}'
For InfluxDB I used influxdb-python library, basing the data logging function on their example:
The final code looks like this:
import bluetooth
import json
from influxdb import InfluxDBClient
import datetime

sensor_address = '07:12:05:15:60:07'
socket = bluetooth.BluetoothSocket(bluetooth.RFCOMM)
socket.connect((sensor_address, 1))

influx = InfluxDBClient('localhost', 8086, 'root', 'root', 'example')
influx.create_database('example')

def log_stats(client, sensor_address, stats):
    json_body = [
        {
            "measurement": "sensor_data",
            "tags": {
                "client": sensor_address,
            },
            "time": datetime.datetime.now(datetime.timezone.utc).isoformat(),
            "fields": {
                "temperature": stats['temperature'],
                "humidity": stats['humidity'],
            }
        }
    ]

    client.write_points(json_body)

buffer = ""

while True:
    data = socket.recv(1024)
    buffer += str(data, encoding='ascii')
    try:
        data = json.loads(buffer)
        print("Received chunk", data)
        log_stats(influx, sensor_address, data)
        buffer = ""
    except json.JSONDecodeError as e:
        continue

socket.close()
3. InfluxDB and Grafana
While not necessary, it is convenient to visualize the sensor data, and here I’ve used InfluxDB (a time-series database) and Grafana (a monitoring solution). With one sensor it’s not terribly necessary, but if multiple sensor units were to be used in different locations - graphing the data all in one place makes it much easier to follow and interpret.
I’ve used Docker Compose to run both Grafana and InfluxDB for prototyping purposes. Of course, in a production environment one would want to set up persistence, proper auth, etc.
version: '2.0'
services:
  influx:
    image: influxdb
    ports:
    - "8086:8086"
    environment:
      INFLUXDB_ADMIN_USER: admin
      INFLUXDB_ADMIN_PASSWORD: admin
  grafana:
    image: grafana/grafana
    ports:
    - "3000:3000"
    links:
    - influx
Running docker-compose up will start InfluxDB on port 8086, and Grafana on port 3000.
$ docker-compose ps                                                                                                                                                                                          1 ↵
           Name                     Command           State           Ports
------------------------------------------------------------------------------------
arduinobluetooth_grafana_1   /run.sh                  Up      0.0.0.0:3000->3000/tcp
arduinobluetooth_influx_1    /entrypoint.sh influxd   Up      0.0.0.0:8086->8086/tcp
I won’t mention all of the setup steps, but some necessary ones:
- Create a new default DB with
curl -G http://localhost:8086/query --data-urlencode "q=CREATE DATABASE example" - Set up InfluxDB connection as a source for Grafana
- Create Grafana dashboards based on sensor data:
SELECT max("temperature") FROM "sensor_data" WHERE $timeFilter GROUP BY time(10s) fill(null)SELECT max("humidity") FROM "sensor_data" WHERE $timeFilter GROUP BY time(10s)
4. Results
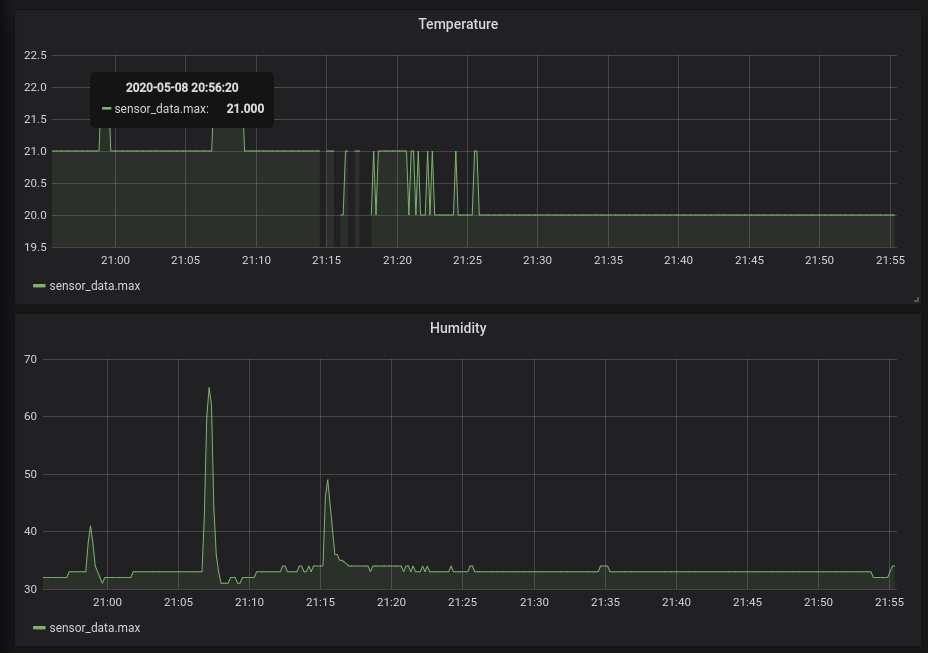
Putting it all together, here’s how the results look like in Grafana. You’ll note that both temperature and humidity are rounded to the nearest integer - this appears to be behavior of the sensor. The three spikes in humidity are from me putting my finger on top of the sensor briefly.
Overall it seems pretty easy to get one device to send data to another device. However, I realize that collecting data from multiple Arduinos would be trickier, requiring to juggle multiple connections, and my JY-MCU Bluetooth module was unable to communicate with multiple Bluetooth clients.
Still, if the Bluetooth module connector was tidied up, it would be fairly easy to break out Arduino and the sensor from the PCB, add a USB powerbank, put it all into an enclosure and have an easily portable data collector.
It was rather convenient to use the Grove Beginner Kit for small scale prototyping like this, as it comes with all sensors already connected in the same PCB, as well as a bunch of sample code to use. If you’d like to pick one up, you can find it here.
Subscribe via RSS